如果Performance data版本不兼容,如何获取IOP卡的基本性能指标
一般情况下想查看IBM i的IOP的性能指标,可以在GO PERFORM工具中通过”3. Print performance report“生成“Resource report”的方法来查看,但是如果Performance data从高版本被保存为低版本后,生成“Resource report”时会报PFR5502“Performance data file(s) are not downward compatible.”的错误消息,提示性能数据不兼容,无法生成资源使用情况报告。
这种情况下如何查看IOP卡的性能指标呢?本文将介绍一种方法来查看IOP卡的基本性能指标。
引起这个问题的根本原因是性能数据版本不兼容,其实可以使用iDoctor提供的CSI(Collection Service Investigator)工具来解决这个问题,下面介绍具体步骤。
1.打开iDoctor,选择“Collection Service Investigator”
2.选择要进行分析的CS数据,如Q248000002 ,找到“Disk”,“Read/write categorized total response Rankings”,然后在右侧的“Report folder”中找到“Read/write categorized total response Rankings by io processor”,如下图中的红色方框所示: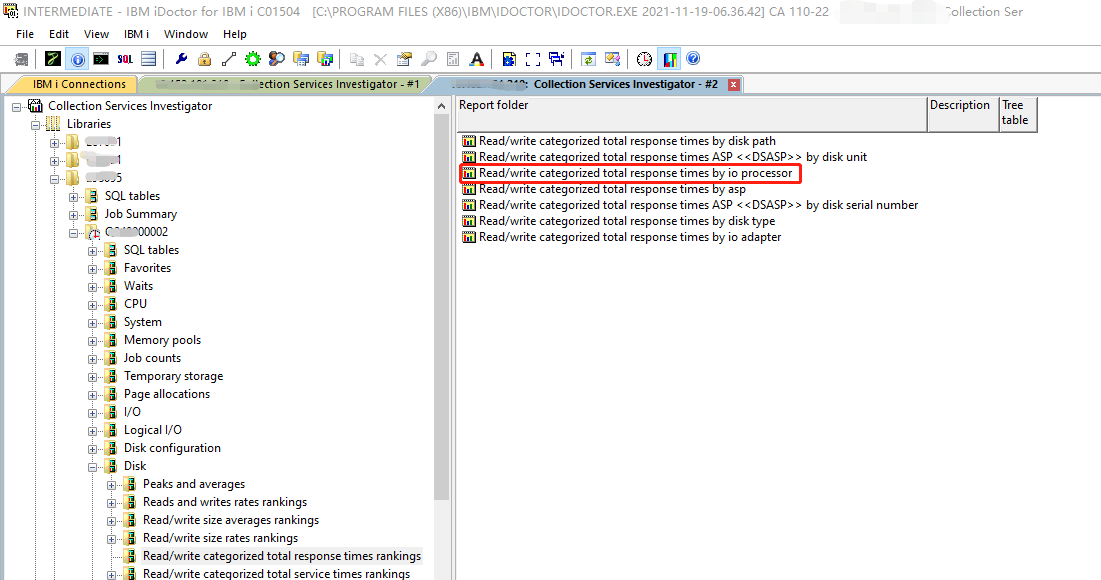
3.用鼠标双击“Read/write categorized total response rankings by io processor”,就可以 看到系统中的每张IOP卡的用时、平均读/写响应时间以及更详细的读/写用时分类。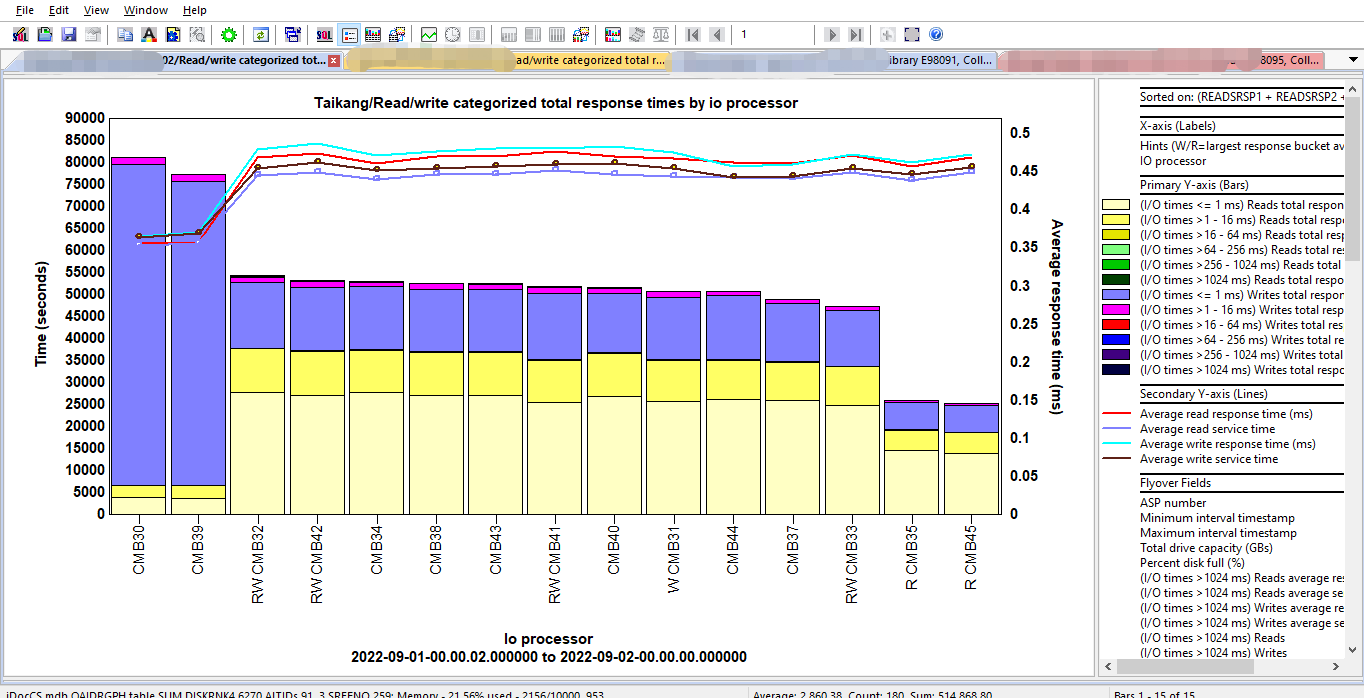
4.如果想分析某几张卡的性能,可以选择相对应IOP卡卡号,如CMP32,CMB42,然后按鼠标右键,选择“Quick View”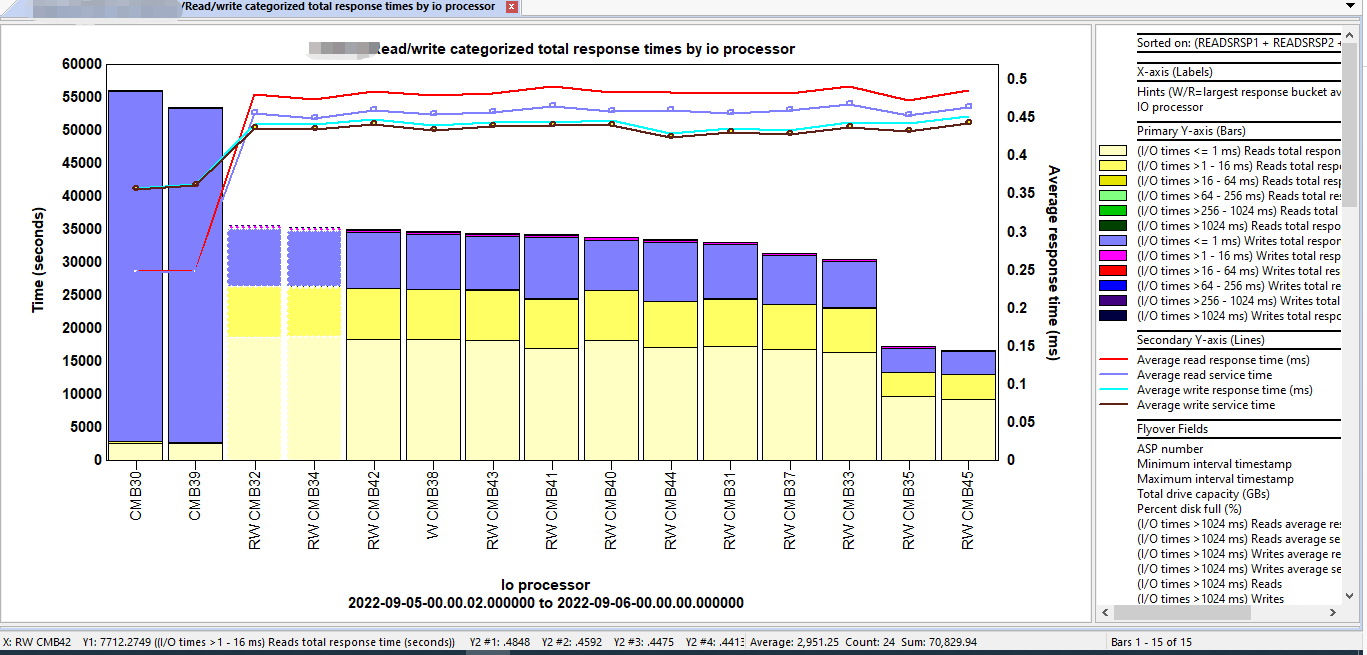
之后就会得出CMB32和CMB42这两张IOP卡的“Average read response time","Average readservice time",“Average write response time","Average write service time",如下图所示:
仅供参考
如果觉得我的文章对您有用,请点赞。您的支持将鼓励我继续创作!
赞0作者其他文章
评论 0 · 赞 6
评论 2 · 赞 3
评论 0 · 赞 4
评论 0 · 赞 4
评论 0 · 赞 2
添加新评论0 条评论