实例解析:利用AIX工具进行性能调优
AIX 常见的系统跟踪工具 (tracing facilities) 包括 System trace , lightweight memory trace (LMT), truss, component trace (CT), POSIX trace, 还有 Probevue 。在定位较深层次的系统性能问题时, System trace 以及基于 trace 的衍生工具(比如 tprof, curt, splat, filemon, netpmon 等等)往往非常有效。本文将基于实际案例,演示 System trace 用于性能分析的一些实际应用场景。
1. 案例描述
本案例为某行业的内存数据库应用,客户反馈的问题是写数据文件极慢,应用进程发生阻塞,阻塞时间可能长达十几秒。经过初步了解,应用的主要逻辑是将汇集的采样数据经过一系列的处理,最终保存至本地 SAS 盘上的数据文件。应用的 IO 采用 mmap 内存映射方式完成,在写文件时,会分配多个并发线程并各自分配固定的文件区域(配置为 4MB ),写满该区域之后再切换至新的文件区域。
注意:
为了保证客户数据隐私,作者根据客户业务逻辑完成了一个模拟程序,用于测试目的。本文所有使用的数据均为使用模拟程序获得。
本例存储采用 SAS 本地盘作为文件存储介质,因此看到的性能数值偏低;使用存储应当能获得至少数倍以上性能提升。
本文中涉及的命令多数在 ”IBM Power Systems Performance Guide Implementing and Optimizing” 中有涉及,相关选项细节可以自行参阅:
http://www.redbooks.ibm.com/abstracts/sg248080.html
1. 问题分析
根据客户的场景描述,该应用的文件读写应当为顺序 IO 类型,且应用层平均 IO 大小为 4M 。属于比较典型的顺序 IO ,按通常的情况,即使写本地 SAS 盘,写带宽也应该能超过 100MBps ,但客户实际场景中带宽仅能达到十几兆字节每秒。
查询文件系统所在的卷组的 LTG 大小为 256K ( 该参数可调,具体内容可以查阅参考文档【 1 】第 4.4.2 章 ) ,也就是说卷组支持的单次最大 IO为256K 。据此,如果应用的平均 IO 大小为 4M ,则系统上观察到的平均 IO 大小应当在 256K 左右。
从实际观察的 IO 带宽看 (topas/iostat) ,实际平均 IO 只有 7.59M/1.52K ≈ 4.99K 左右 :
从 iostat 的输出看也是如此:
看到这里,很自然地需要确认应用是否的确是顺序 IO 类型。这需要对应用逻辑进行确认,重点是通过系统调用进行 IO 交互的部分逻辑。这部分工作可以通过查看应用源码进行,也可以通过系统跟踪工具(比如 trace/truss/probevue 等)来完成。
先做一个简单的 truss 系统调用开销统计( -c 选项进行统计, Ctrl+C 键终止统计):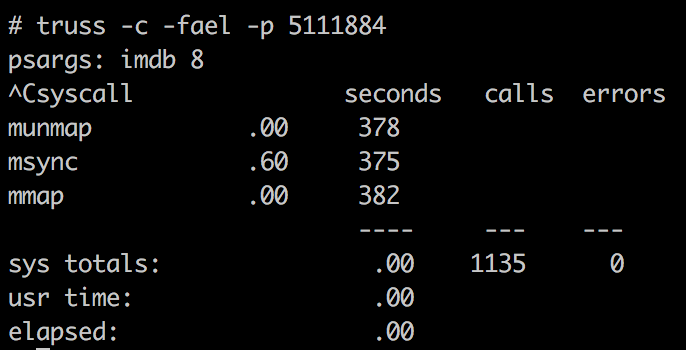
可以看到应用确实使用的 mmap 映射 IO 方式读写文件。
继续 truss 跟踪 mmap 、 munmap 、 msync 等相关的调用,可以发现应用刷新的 IO 块大小 (msync 的第二个参数 ) 为 4194304 = 4MB ,也符合客户对应用的描述。从 truss 的结果也能够看到,的确很多 msync 看起来很慢,比如截图中最后一个 msync耗时达到了0.6974秒。
由于 truss –D 看到的系统调用时间是较粗略的估计值,下面我们通过 curt 报告进行进一步确认,如下:
可以看到, msync 调用的平均历时长达 2198.7598 毫秒。而该函数实际消耗的 CPU 时间仅为 4.8994 毫秒,说明绝大部分时间都处于等待 IO 完成的状态。
抽取 imdb 的其中一个线程 56361101 ,检查其 trace report 报告:
grep “ 56361101 “ trace.ascii > 56361101.txt
可以看到,虽然 msync 一次刷新了 4MB 的页面,但实际对应到文件系统写时是大量的实际大小仅为 4K (bcount=0x1000) 的小块写操作,这应当是 msync 历时很长的根本原因:
从 filemon 报告也能看到这一点:平均的每次写大小为 9.1 块,即 9.1 * 512 B = 4.55KB ,说明多数写大小仅为 1 页;同时高达99.9%的寻道比例说明IO类型为纯随机型IO:
应用层 IO 大小为 4M 的顺序写,而实际观察到的系统层面磁盘 IO 为 4K 的随机写,这通常是 IO 碎片造成的。我们可以通过 fileplace 命令确认 JFS2 文件系统中的文件在磁盘上的分布情况,检查是否存在碎片:
从 fileplace 命令输出看,该数据文件顺序性 (sequentiality) 的确极差 (7.9%) 。这应该是造成问题的根本原因。
基System trace,生成trace report报告、curt报告和filemon报告的方法:
采集 system trace:
#trace -anf -T40000000 -L40000000 -C all -o ./trace.raw

#sleep 20

#trcstop
生成 curt 报告:
#curt -i ./trace.raw -ptes > curt.out生成 filemon 报告:
#gensyms -F > gensyms.out

#filemon -i ./trace.raw -n gensyms.out -O all,detailed -o filemon.out
生成 trace report 报告:
#trcrpt -Opid=on,tid=on,exec=on,svc=on,timestamp=1 ./trace.raw > trace.ascii注意:trace工具会带来一定系统开销,如需在生产环境使用,请事先联系IBM支持人员确认
1. 解决方案
进一步调查发现,客户应用创建了一个空文件,然后 ftruncate 成实际的大小 ( 例如 4GB) ;之后再以 mmap 方式映射到内存并写入内容。 8 个工作线程同时映射该文件,并发访问不同的文件区域。
由于 ftruncate 并不实际分配文件存储空间,实际的空间分配是在 8 个工作线程写入到具体的区域才进行( Allocation on Write ),由于多个并发写线程在时序上有重合,文件的多个区域并发分配,所以造成了严重的碎片问题。
因此在访问 mmap 内存映射区域,不涉及物理 IO 的情况下,性能表现完全正常;一旦出现 msync ,就会造成长时间挂起。
可行的解决方法有如下两类。
解决方案 1 :改变应用的文件预处理方式
在应用创建数据文件时,提前完成初始化,避免写时分配,保证文件存储连续性。比如:
#dd if=/dev/zero of=./m.txt bs=1M count=32

#imdb 8
优化后的文件块分配情况:
在提前创建文件的情况下,文件本身存储在一段连续的文件块上,顺序性达到了 100% 。
优化后实测 IO 带宽达到了 160MBps ,远远超过优化前不到 10MBps 的写带宽 : 
curt 报告可以看到, msync 调用的平均历时有了明显的改善,从优化前的 2198.7598 毫秒,改善到目前的117.6793毫秒 。
msync 单次刷新的 IO 块大小也达到了 0x40000 = 256KB ,即 LTG 大小,符合预期的理想状态:
filemon 报告看到的平均每次 IO 大小为 512blks ,即 256KB 。而 seek 比例也下降到 4.1% ,说明大多数 IO 为顺序型:
解决方案 2 :使用文件块更大的文件系统
比如创建 blocksize 为 4MB 的 GPFS 文件系统,存放该数据文件。
采用 GPFS 之后的文件块分布情况:
实测优化后的IO写带宽达到了129MBps ,如下:
curt 报告的 msync 性能也有明显改善:
跟踪 mmfs 的 trace report ,也能看到 IO 块大小达到了 256K:

从 filemon 看到的平均 IO 大小为 509.4 ,寻道比例为 3.8% 。整体表现略差于提前顺序初始化数据文件时的性能。
修改后性能问题解决。
说明:
同样的程序在使用 xfs 文件系统的 linux 平台也有碎片现象,但由于 xfs 文件系统的空间分配策略不同,文件碎片问题不突出。 Linux 平台优化前后性能差别在 30%~40% 左右,不及 AIX 差别显著。
参考 Linux 平台优化前后的碎片情况。优化前:
优化后:
1. 附录
测试步骤:
#**./imdb <** **并发线程数****>**测试程序:
/*

* The following [enclosed] code is sample code created by IPS

* Corporation. This sample code is not part of any standard IPS product

* and is provided to you solely for the purpose of demonstration.

* The code is provided 'AS IS',

* without warranty of any kind. IPS shall not be liable for any damages

* arising out of your use of the sample code, even if they have been

* advised of the possibility of such damages.

*/

/*

To compile: xlC_r imdb.cpp -o imdb

Problem report: chenchihui@inspur.com

*/

#include

#include

#include

#include

#include

#include

#include

#include

#include

#include

#include

#define MAXTHREADNUM 128

#define INTERVAL 10000

#define BUF_SIZE 4*1024*1024

int testmmap(int arg)

{

int fd = 0, n = 0, i = 0;

timeval start, end;

void *mp = NULL;

struct stat sbuf;

char idx = 0;

long interval;

int mplen = BUF_SIZE;

if((fd = open("m.txt", O_RDWR, 0644)) >= 0)

{

fstat(fd, &sbuf);

printf("file size = %d\\n", sbuf.st_size); }

else

{

printf("open failed\\n");

return 0;

}

while(1)

{

idx++;

if((mp = mmap(NULL, mplen, PROT_READ|PROT_WRITE, MAP_SHARED, fd, arg*BUF_SIZE)) != (void*)-1 )

{

memset(mp, idx, mplen);

msync(mp, mplen, MS_SYNC);

munmap(mp, mplen);

}

} //while

close(fd);

return 0;

}

extern "C" void* testfunc(void* arg)

{

unsigned int i=0;

int ret = 0;

testmmap((long)arg);

return NULL;

}

int main(int argc, char* argv[])

{

pthread_t tid[MAXTHREADNUM] = {0};

int ret;

struct stat sbuf;

if(argc < 2)

{

printf("usage: %s \\n", argv[0]);

return 0;

}

int count = atoi(argv[1]);

if(count > MAXTHREADNUM)

count = MAXTHREADNUM;

int fd, bufsz;

bufsz = count * BUF_SIZE;

if((fd = open("m.txt", O_RDWR|O_CREAT, 0644)) > 0)

{

fstat(fd, &sbuf);

printf("file size = %d\\n", sbuf.st_size);

ftruncate(fd, bufsz); //file is truncated, this might cause fragmentation if the file is not allocated.

fstat(fd, &sbuf);

printf("file size after truncate = %d\\n", sbuf.st_size);

}

close(fd);

for(long i =0; i < count; i++)

{

ret = pthread_create(&tid[i], NULL, testfunc, (void*)i);

if(ret != 0)

{

printf("pthread_create error, err=%d\\n", ret);

return -1;

}

}

void* status;

for(int i =0; i < count; i++)

{

pthread_join(tid[i], &status);

printf("thread %d exit status = %ld\\n", tid[i], (long)status);

}

return 0;

}如果觉得我的文章对您有用,请点赞。您的支持将鼓励我继续创作!
赞2作者其他文章
评论 1 · 赞 6
评论 0 · 赞 0
评论 0 · 赞 1
评论 0 · 赞 2
评论 0 · 赞 3
添加新评论0 条评论