
如何搭建 Linux 服务器监控系统
分享一下如何监控自己的 linux 服务器。这里涉及到三个组件
- node-exporter:运行在宿主机器上的 exporter,对机器的各种指标进行采集,然后暴露给 Prometheus
- Prometheus:SoundCloud 开源的系统监控和告警套件,Prometheus 将采集到的指标(metrics)储存到本地的时序数据库上
- Grafana:一个数据可视化工具,有着丰富的图表类型,支持各种数据源,可以对接 Prometheus,对 Pormetheus 采集的数据进行可视化展示
node-exporter 下载安装
到 node-exporter 下载地址:https://prometheus.io/download/, 下载最新版本的 node-exporter,然后启动,现在最新的版本是 1.6.1,完整的命令如下
$ cd /opt
$ wget https://github.com/prometheus/node_exporter/releases/download/v1.6.1/node_exporter-1.6.1.linux-amd64.tar.gz
$ tar -zxvf node_exporter-1.6.1.linux-amd64.tar.gz
$ mv node_exporter-1.6.1.linux-amd64.tar.gz node_exporter-1.6.1
$ cd node_exporter-1.6.1
$ ./node-exporter
看到下面日志证明启动成功
INFO[0000] Starting node_exporter (version=0.16.0, branch=HEAD, revision=d42bd70f4363dced6b77d8fc311ea57b63387e4f)  source="node_exporter.go:82"
INFO[0000] Build context (go=go1.9.6, user=root@a67a9bc13a69, date=20180515-15:53:28)  source="node_exporter.go:83"
INFO[0000] Enabled collectors:                           source="node_exporter.go:90"
INFO[0000]  - boottime                                   source="node_exporter.go:97"
...
INFO[0000] Listening on :9100                            source="node_exporter.go:111"
node-exporter 监听的端口是 9100,我们可以通过访问 /metrics 端点,查看 node-exporter 采集的各项指标
$ curl http://localhost:9100/metrics
# HELP go_gc_duration_seconds A summary of the pause duration of garbage collection cycles.
# TYPE go_gc_duration_seconds summary
go_gc_duration_seconds{quantile="0"} 2.8059e-05
go_gc_duration_seconds{quantile="0.25"} 3.3418e-05
go_gc_duration_seconds{quantile="0.5"} 3.6487e-05
go_gc_duration_seconds{quantile="0.75"} 4.2713e-05
go_gc_duration_seconds{quantile="1"} 0.000280907
go_gc_duration_seconds_sum 0.056002235
go_gc_duration_seconds_count 1192
...
可以看到,node-exporter 暴露了很多系统指标,并且在指标的上面都有对这个指标具体含义的注释,比如 node_filesystem_avail_bytes 指标,表示的是文件系统剩余可用空间
$ curl http://localhost:9100/metrics | grep node_filesystem_avail_bytes
# HELP node_filesystem_avail_bytes Filesystem space available to non-root users in bytes.
# TYPE node_filesystem_avail_bytes gauge
node_filesystem_avail_bytes{device="/dev/mapper/centos-root",fstype="xfs",mountpoint="/"} 1.5703752704e+10
node_filesystem_avail_bytes{device="/dev/sda1",fstype="xfs",mountpoint="/boot"} 9.19465984e+08
node_filesystem_avail_bytes{device="tmpfs",fstype="tmpfs",mountpoint="/run"} 5.01690368e+08
node_filesystem_avail_bytes{device="tmpfs",fstype="tmpfs",mountpoint="/run/user/0"} 1.01957632e+08
不过我们不用了解所有的指标(指标实在太多了,也了解不过来,除非你要做仪表盘开发),后面接入 Grafana 后,可以通过可视化的方式查看各项指标
### prometheus 安装
同样的,从 prometheus 官网(https://prometheus.io/download/)下载最新的压缩包
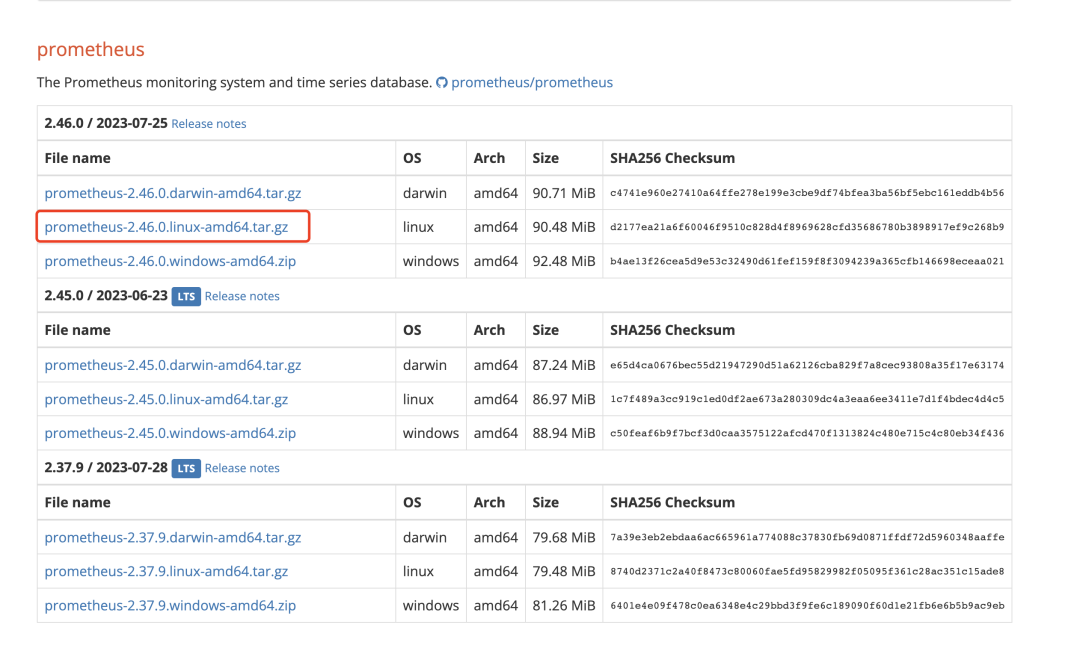
我这里下载的是 2.46.0 版本,下载完对其解压
$ cd /opt
$ wget https://github.com/prometheus/prometheus/releases/download/v2.46.0/prometheus-2.46.0.linux-amd64.tar.gz
$ tar -zxvf prometheus-2.46.0.linux-amd64.tar.gz
$ mv prometheus-2.46.0.linux-amd64.tar.gz prometheus-2.46.0
使用 systemd 托管 prometheus 服务,参考下面命令
$ cat <<EOF >/etc/systemd/system/prometheus.service
[Unit]
Description="prometheus"
Documentation=https://prometheus.io/
After=network.target

[Service]
Type=simple

ExecStart=/opt/prometheus/prometheus  --config.file=/opt/prometheus/prometheus.yml --storage.tsdb.path=/opt/prometheus/data --web.enable-lifecycle --enable-feature=remote-write-receiver --query.lookback-delta=2m --web.enable-admin-api

Restart=on-failure
SuccessExitStatus=0
LimitNOFILE=65536
StandardOutput=syslog
StandardError=syslog
SyslogIdentifier=prometheus

[Install]
WantedBy=multi-user.target
EOF

$ systemctl enable prometheus
如果不想注册成系统服务的话,也可以采用命令启动的方式,直接执行 ExexStart 的命令即可
配置 pormetheus,对 node-exporter 暴露的指标进行采集,prometheus 默认的配置文件为安装目录下的 prometheus.yml,这里我们直接修改配置文件,在scrape_configs节点下添加一个node-exporter的配置,完整的配置文件如下:
# my global config
global:
  scrape_interval: 15s # Set the scrape interval to every 15 seconds. Default is every 1 minute.
  evaluation_interval: 15s # Evaluate rules every 15 seconds. The default is every 1 minute.
  # scrape_timeout is set to the global default (10s).

# Alertmanager configuration
alerting:
  alertmanagers:
    - static_configs:
        - targets:
          # - alertmanager:9093

# Load rules once and periodically evaluate them according to the global 'evaluation_interval'.
rule_files:
  # - "first_rules.yml"
  # - "second_rules.yml"

# A scrape configuration containing exactly one endpoint to scrape:
# Here it's Prometheus itself.
scrape_configs:
  # The job name is added as a label `job=<job_name>` to any timeseries scraped from this config.
  - job_name: "prometheus"

    # metrics_path defaults to '/metrics'
    # scheme defaults to 'http'.

    static_configs:
      - targets: ["localhost:9090"]

 # 增加 node-exporter 采集任务
  - job_name: 'node-exporter'
    static_configs:
      - targets: ['localhost:9100']
启动 prometheus 服务
$ systemctl start prometheusprometheus 默认的访问端口是 9090 ,浏览器访问 9090 端口,就可以看到 prometheus 服务

在这里,我们可以对采集的指标进行查询,比如上面提到的 node_filesystem_avail_bytes

### Grafna 安装
虽然 prometheus 提供了指标查询的页面,但是该页面太简单了,满足不了我们日常的监控需求,大部分使用 prometheus 的用户,都会使用 grafana 进行数据的展示
grafana 下载地址:https://grafana.com/grafana/download?pg=get&;plcmt=selfmanaged-box1-cta1&edition=oss

这里我们通过下载二进制包的方式进行安装
cd /opt
$ wget https://dl.grafana.com/oss/release/grafana-10.0.3.linux-amd64.tar.gz
$ tar -zxvf grafana-10.0.3.linux-amd64.tar.gz
$ mv grafana-10.0.3.linux-amd64.tar.gz grafana-10.0.3
启动 grafana
$ cd grafana-10.0.3/bin
$ nohup ./grafana-server 2>&1 &
grafana 监控端口是 3000,我们可以访问机器的 3000 端口,查看 grafana 界面

接着在 grafana 中添加 prometheus 数据源,在 Home > Connections > Data sources 中,找到 Add remote data sources 按钮

数据源选择 Prometheus,然后填充数据源地址,因为我 prometheus 跟 grafana 安装在同一台机器上,所以这里填 http://localhost:9090 ,保存即可

添加完数据源之后,就可以在 dashboard 中,添加我们想要的仪表盘。找到 Home > Dashboards > New > Import 按钮

填写我们的仪表盘 ID,或者仪表盘的 JSON 文件。好在 Grafana 社区有很多制作了大量的仪表盘,我们可以在 https://grafana.com/grafana/dashboards/ 中搜索我们想要的仪表盘,直接导入即可,比如搜索 Node-exporter 仪表盘

找到自己想要的仪表盘,复制 id,导入到 grafana 中即可,我这里使用的仪表盘 ID 是 17577

导入就能看到 linux 机器的各项监控指标了 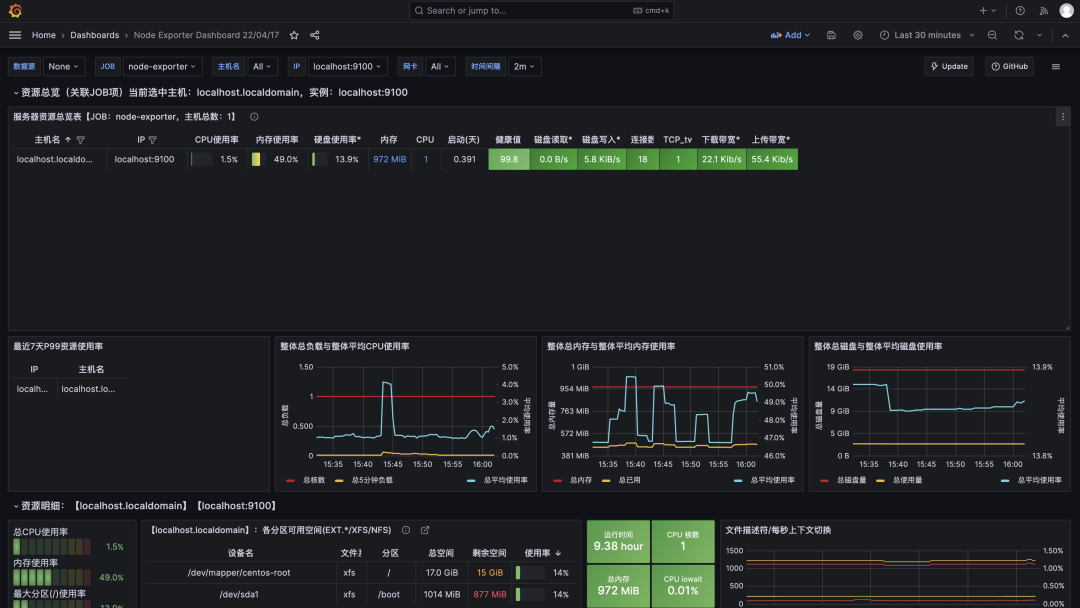
有了 grafana 仪表盘,我们就可以很方便的在仪表盘上查看各个 linux 的资源情况,如 CPU/内存使用率、磁盘读写情况、带宽使用等,及时发现系统异常
如果觉得我的文章对您有用,请点赞。您的支持将鼓励我继续创作!
赞2
添加新评论0 条评论