Prometheus的架构及持久化
Prometheus是什么
Prometheus是一个开源的系统监控和报警工具,特点是:
- 多维数据模型(时序列数据由metric名和一组key/value组成)
- 在多维度上灵活的查询语言(PromQl)
- 不依赖分布式存储,单主节点工作.
- 通过基于HTTP的pull方式采集时序数据
- 可以通过push gateway进行时序列数据推送(pushing)
- 可以通过服务发现或者静态配置去获取要采集的目标服务器
- 多种可视化图表及仪表盘支持
pull方式
Prometheus采集数据是用的pull也就是拉模型,通过HTTP协议去采集指标,只要应用系统能够提供HTTP接口就可以接入监控系统,相比于私有协议或二进制协议来说开发、简单。
push方式
对于定时任务这种短周期的指标采集,如果采用pull模式,可能造成任务结束了,Prometheus还没有来得及采集,这个时候可以使用加一个中转层,客户端推数据到Push Gateway缓存一下,由Prometheus从push gateway pull指标过来。(需要额外搭建Push Gateway,同时需要新增job去从gateway采数据)
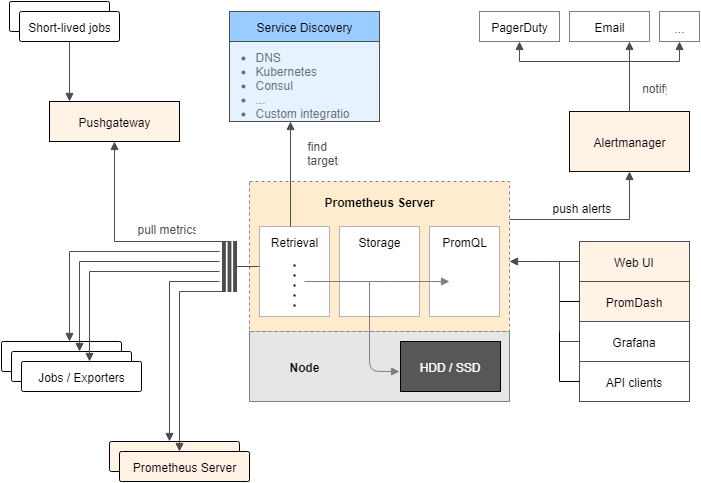
组成及架构
- Prometheus server 主要负责数据采集和存储,提供PromQL查询语言的支持
- 客户端sdk 官方提供的客户端类库有go、java、scala、python、ruby,其他还有很多第三方开发的类库,支持nodejs、php、erlang等
- Push Gateway 支持临时性Job主动推送指标的中间网关
- PromDash 使用rails开发的dashboard,用于可视化指标数据
- exporters 支持其他数据源的指标导入到Prometheus,支持数据库、硬件、消息中间件、存储系统、http服务器、jmx等
- alertmanager 实验性组件、用来进行报警
- prometheus_cli 命令行工具
- 其他辅助性工具
架构图如下:
默认配置
docker exec -it a9bd827a1d18 less /etc/prometheus/prometheus.yml得到
# my global config
global:
  scrape_interval:     15s # Set the scrape interval to every 15 seconds. Default is every 1 minute.
  evaluation_interval: 15s # Evaluate rules every 15 seconds. The default is every 1 minute.
  # scrape_timeout is set to the global default (10s).

  # Attach these labels to any time series or alerts when communicating with
  # external systems (federation, remote storage, Alertmanager).
  external_labels:
      monitor: 'codelab-monitor'

# Load rules once and periodically evaluate them according to the global 'evaluation_interval'.
rule_files:
  # - "first.rules"
  # - "second.rules"

# A scrape configuration containing exactly one endpoint to scrape:
# Here it's Prometheus itself.
scrape_configs:
  # The job name is added as a label `job=<job_name>` to any timeseries scraped from this config.
  - job_name: 'prometheus'

    # metrics_path defaults to '/metrics'
    # scheme defaults to 'http'.

    static_configs:
- targets: ['localhost:9090']- crape_interval 这里是指每隔15秒钟去抓取数据(这里)
- evaluation_interval 指的是计算rule的间隔
Push Gateway
pushgateway有单独的镜像
docker pull prom/pushgateway对于喜欢用push模式的应用来说,可以专门搭建一个push gateway,来适配一下。
storage
prometheus使用了G家的LevelDB来做索引(PromSQL重度依赖LevelDB),对于大量的采样数据有自己的存储层,Prometheus为每个时序数据创建一个本地文件,以1024byte大小的chunk来组织。
磁盘文件
Prometheus在storage.local.path指定的路径存储文件,默认为./data。关于chunk编码有三种
- type 0
第一代的编码格式,simple delta encoding
- type 1
目前默认的编码格式,double-delta encoding
- type 2
variable bit-width encoding,facebook的时间序列数据库Beringei采用的编码方式
内存使用
prometheus在内存里保存了最近使用的chunks,具体chunks的最大个数可以通过storage.local.memory-chunks来设定,默认值为1048576,即1048576个chunk,大小为1G。 除了采用的数据,prometheus还需要对数据进行各种运算,因此整体内存开销肯定会比配置的local.memory-chunks大小要来的大,因此官方建议要预留3倍的local.memory-chunks的内存大小。
As a rule of thumb, you should have at least three times more RAM available than needed by the memory chunks alone
可以通过server的metrics去查看prometheus_local_storage_memory_chunks以及process_resident_memory_byte两个指标值。
- prometheus_local_storage_memory_chunks
The current number of chunks in memory, excluding cloned chunks 目前内存中暴露的chunks的个数
- process_resident_memory_byte
Resident memory size in bytes 驻存在内存的数据大小
- prometheus_local_storage_persistence_urgency_score 介于0-1之间,当该值小于等于0.7时,prometheus离开rushed模式。 当大于0.8的时候,进入rushed模式
- prometheus_local_storage_rushed_mode 1表示进入了rushed mode,0表示没有。进入了rushed模式的话,prometheus会利用storage.local.series-sync-strategy以及storage.local.checkpoint-interval的配置加速chunks的持久化。
storage参数
run -p 9090:9090 \\
-v /tmp/prometheus-data:/prometheus-data \\
prom/prometheus \\
-storage.local.retention 168h0m0s \\
-storage.local.max-chunks-to-persist 3024288 \\
-storage.local.memory-chunks=50502740 \\
-storage.local.num-fingerprint-mutexes=300960
storage.local.memory-chunks
设定prometheus内存中保留的chunks的最大个数,默认为1048576,即为1G大小
storage.local.retention
用来配置采用数据存储的时间,168h0m0s即为24*7小时,即1周
storage.local.series-file-shrink-ratio
用来控制序列文件rewrite的时机,默认是在10%的chunks被移除的时候进行rewrite,如果磁盘空间够大,不想频繁rewrite,可以提升该值,比如0.3,即30%的chunks被移除的时候才触发rewrite。
storage.local.max-chunks-to-persist
该参数控制等待写入磁盘的chunks的最大个数,如果超过这个数,Prometheus会限制采样的速率,直到这个数降到指定阈值的95%。建议这个值设定为storage.local.memory-chunks的50%。Prometheus会尽力加速存储速度,以避免限流这种情况的发送。
storage.local.num-fingerprint-mutexes
当prometheus server端在进行checkpoint操作或者处理开销较大的查询的时候,采集指标的操作会有短暂的停顿,这是因为prometheus给时间序列分配的mutexes可能不够用,可以通过这个指标来增大预分配的mutexes,有时候可以设置到上万个。
storage.local.series-sync-strategy
控制写入数据之后,何时同步到磁盘,有'never', 'always', 'adaptive'. 同步操作可以降低因为操作系统崩溃带来数据丢失,但是会降低写入数据的性能。 默认为adaptive的策略,即不会写完数据就立刻同步磁盘,会利用操作系统的page cache来批量同步。
storage.local.checkpoint-interval
进行checkpoint的时间间隔,即对尚未写入到磁盘的内存chunks执行checkpoint操作。
如果觉得我的文章对您有用,请点赞。您的支持将鼓励我继续创作!
赞0作者其他文章
评论 0 · 赞 2
评论 0 · 赞 1
评论 0 · 赞 0
评论 0 · 赞 0
评论 0 · 赞 1
添加新评论0 条评论