Hyperledger Caliper测试Hyperledger Fabric并用Prometheus Grafana监控
目录
- -
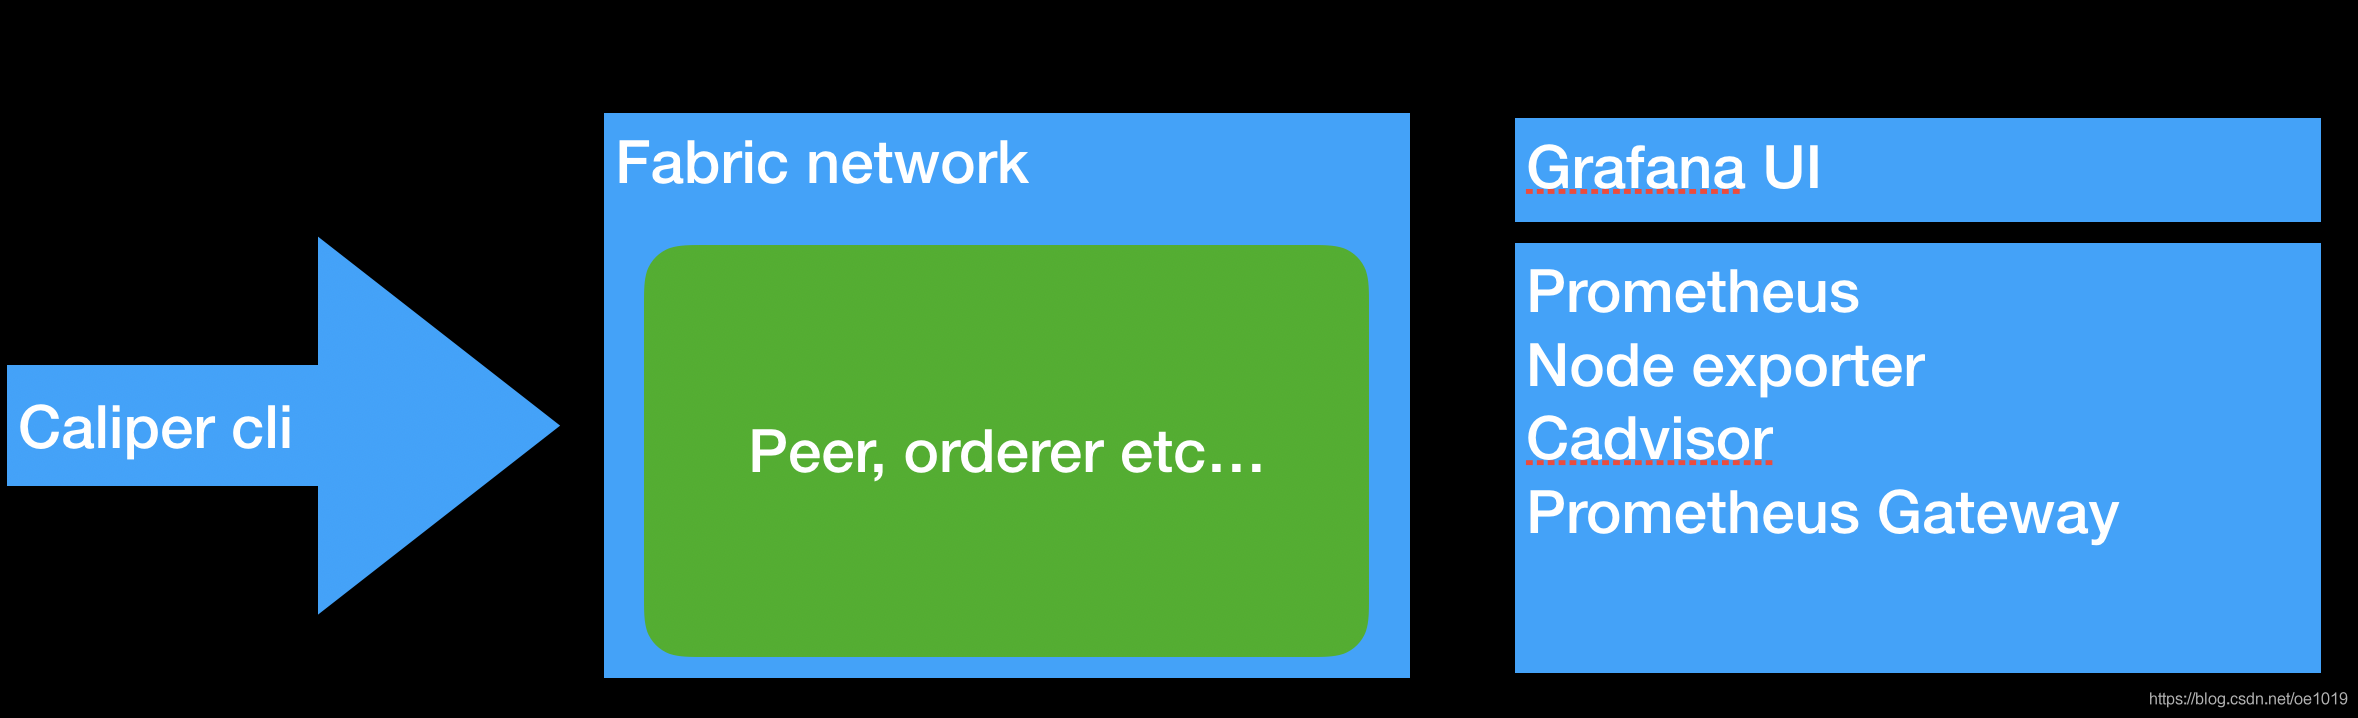
架构
这里我采用了Hyperledger Caliper来对本地的fabric network进行压力测试,同时用Prometheus对本机性能指标进行监控。通过Grafana进行可视化。
步骤
1. 配置本机的Prometheus
这里我们使用nodeexporter来监控本机性能开销,使用cadvisor来监控各个contianer,Grafana做UI。
- 修改docker composer文件,设置Prometheus
- 在启动Grafana UI后倒入相应的Prometheus data source,和Prometheus的dash board。
- 之后倒入Docker and OS metrics ( cadvisor, node_exporter )这个Grafana官网上可以下载的dashboard
配置文件:
Prometheus.yaml:
global:
  scrape_interval:     60s
  evaluation_interval: 60s

scrape_configs:
  - job_name: prometheus
    static_configs:
      - targets: ['localhost:9090']
        labels:
          instance: prometheus

  - job_name: containers
    static_configs:
      - targets: ['cadvisor:8080']
        labels:
          instance: cadvisor

  - job_name: nodeexporter
    static_configs:
      - targets: ['nodeexporter:9100']
        labels:
          instance: nodeexporter
docker composer:
  nodeexporter:
    container_name: nodeexporter
    image: prom/node-exporter
    ports:
      - 9100:9100
    volumes:
      - /proc:/host/proc
      - /sys:/host/sys
      - /:/rootfs
    networks:
      - byfn

  cadvisor:
    container_name: cadvisor
    image:  google/cadvisor
    ports:
      - 8080:8080
    volumes:
      - /:/rootfs:ro
      - /var/run:/var/run:ro
      - /sys:/sys:ro
      - /var/lib/docker/:/var/lib/docker:ro
      - /dev/disk/:/dev/disk:ro
    networks:
      - byfn

  prometheus:
    container_name: prometheus
    image: prom/prometheus
    ports:
      - "9090:9090"
    volumes:
      - /Users/yuanyi/go/src/github.com/fabric-samples/prometheus/prometheus.yml:/etc/prometheus/prometheus.yml
    networks:
      - byfn

  grafana:
    container_name: grafana
    image:   grafana/grafana
    ports:
      - "3000:3000"
    volumes:
      - /Users/yuanyi/go/src/github.com/fabric-samples/prometheus/grafana/grafana:/var/lib/grafana
      - /Users/yuanyi/go/src/github.com/fabric-samples/prometheus/grafana/conf:/usr/share/grafana/conf
    networks:
      - byfn
2.联通Fabric与Prometheus
根据Fabric 1.4的文档,添加对应的环境变量。
  orderer.example.com:
    extends:
      file:   base/docker-compose-base.yaml
      service: orderer.example.com
    container_name: orderer.example.com
    environment:
      - ORDERER_OPERATIONS_LISTENADDRESS=0.0.0.0:8443
      - ORDERER_METRICS_PROVIDER=prometheus
    ports:
      - 8443:8443
    networks:
      - byfn

  peer0.org1.example.com:
    container_name: peer0.org1.example.com
    extends:
      file:  base/docker-compose-base.yaml
      service: peer0.org1.example.com
    environment:
      - CORE_OPERATIONS_LISTENADDRESS=0.0.0.0:9443
      - CORE_METRICS_PROVIDER=prometheus
    ports:
      - 9443:9443
    networks:
      - byfn
跟新Prometheus配置文件,添加对应配置
  - job_name: orderer
    static_configs:
      - targets: ['orderer.example.com:8443']
        labels:
          instance: localhost

  - job_name: peer
    static_configs:
      - targets: ['peer0.org1.example.com:9443']
        labels:
          instance: localhost
在Grafana中配置fabric的dashborad,这里我使用了Fabric explor的dashboard:
3.联通Caliper与Prometheus
根据Caliper的文档,添加Prometheus push gateway
  pushGateway:
    image: prom/pushgateway
    container_name: pushGateway
    ports:
      - "9091:9091"
    networks:
      - byfn
更新Prometheus配置链接push gateway:
  - job_name: pushGateway
    static_configs:
    - targets: ['pushGateway:9091']
      labels:
          instance: pushGateway
在Caliper测试集中添加监控:
    "type": ["docker", "process","prometheus"],
    "docker":{
      "name": ["all"]
    },
    "process": [
      {
        "command" : "node",
        "arguments" : "local-client.js",
        "multiOutput" : "avg"
      }
    ],
    "prometheus": {
      "url":"http://localhost:9090",
      "push_url":"http://localhost:9091"
    },
    "metrics": {
      "ignore": ["prometheus", "pushGateway", "cadvisor", "grafana", "node-exporter"],
      "include":{
        "Endorse Time (s)":{
          "query":"rate(endorser_propsal_duration_sum{chaincode=\\"mycc\\"}[5m])/rate(endorser_propsal_duration_count{chaincode=\\"mycc\\"}[5m])",
          "step": 1,
          "label": "instance",
          "statistic": "avg"
        },
        "Max Memory (MB)": {
          "query":"sum(container_memory_rss{name=~\\".+\\"}) by (name)",
          "step": 10,
          "label": "instance",
          "statistic": "max",
          "multiplier": 0.000001
        }
      }
    },
在Grafana中新建panel,添加query
rate(endorser_propsal_duration_sum{chaincode="mycc:1.0"}[5m])/rate(endorser_propsal_duration_count{chaincode="mycc:1.0"}[5m])

sum(container_memory_rss{name=~\\".+\\"}) by (name)"
4.压力测试开跑
结果:


相关的代码改动
https://github.com/SamYuan1990/FabriccaliperSample
Hyperledger Fabric性能测试相关文章总结(个人向)
https://blog.csdn.net/oe1019/article/details/106445904
转载自本人csdn
著作权归作者所有
如果觉得我的文章对您有用,请点赞。您的支持将鼓励我继续创作!
赞0Ctrl+Enter 发表
添加新评论0 条评论