记一次Ziplist导致Redis Core Dump分析
虽然Redis release notes里经常有提到,由于某bug会造成Redis core了。也许很幸运,使用多年官方的Redis,我确实没有遇到过core(ps:目前管理实例数是六位数的)。讲真,写这么一篇文章,我瑟瑟发抖,一直以来虽然我一直做Redis相关的工作,但处理这种问题不太多,所以哪里写的不对,欢迎指正。
清明节,突然收到报警某个Redis slave节点down了,迅速排查下,发现进程不在了,一般这种很大可能是因为机器OOM了,查了一下机器内存空闲70%,于是看了一下竟然core了。

Redis的版本是3.2.12
一、Redis的crash log
Redis的crash log还是非常给力的,里面包含了info、client list、当时堆栈信息、当前客户端的一些信息,下面可以看下。
1. 概览
可以看到t_zset.c的1129行(t_zset.c:1129 'dictAdd(zs->dict,ele,&node->score) == DICT_OK' is not true)造成crash,当时Object的信息也给出来了:sorted类型、encoding=5代表ziplist类型。
=== REDIS BUG REPORT START: Cut & paste starting from here ===
23368:S 05 Apr 18:18:46.621 # === ASSERTION FAILED OBJECT CONTEXT ===
23368:S 05 Apr 18:18:46.621 # Object type: 3
23368:S 05 Apr 18:18:46.621 # Object encoding: 5
23368:S 05 Apr 18:18:46.621 # Object refcount: 1
23368:S 05 Apr 18:18:46.621 # Sorted set size: 257
23368:S 05 Apr 18:18:46.621 # === ASSERTION FAILED ===
23368:S 05 Apr 18:18:46.621 # ==> t_zset.c:1129 'dictAdd(zs->dict,ele,&node->score) == DICT_OK' is not true
23368:S 05 Apr 18:18:46.621 # (forcing SIGSEGV to print the bug report.)
23368:S 05 Apr 18:18:46.621 # Redis 3.2.12 crashed by signal: 11
23368:S 05 Apr 18:18:46.621 # Crashed running the instuction at: 0x45c25f
23368:S 05 Apr 18:18:46.621 # Accessing address: 0xffffffffffffffff
23368:S 05 Apr 18:18:46.621 # Failed assertion: dictAdd(zs->dict,ele,&node->score) == DICT_OK (t_zset.c:1129)
1129行代码如下:

2.堆栈
从堆栈可以看出来,Redis在处理zadd命令后发生了core,最后一个方法栈就是zsetConvert,其中1129行就在这里面。
------ STACK TRACE ------
EIP:
bin/redis-server *:13676(_serverAssert+0x6f)[0x45c25f]
Backtrace:
bin/redis-server *:13676(logStackTrace+0x3c)[0x45c78c]
bin/redis-server *:13676(sigsegvHandler+0xa3)[0x45d673]
/lib64/libpthread.so.0(+0xf5e0)[0x7fbbe6b605e0]
bin/redis-server *:13676(_serverAssert+0x6f)[0x45c25f]
bin/redis-server *:13676(zsetConvert+0x27d)[0x44de5d]
bin/redis-server *:13676(zaddGenericCommand+0x707)[0x44e5f7]
bin/redis-server *:13676(call+0x72)[0x424652]
bin/redis-server *:13676(processCommand+0x365)[0x42a5f5]
bin/redis-server *:13676(processInputBuffer+0x109)[0x435349]
bin/redis-server *:13676(aeProcessEvents+0x1ab)[0x41fc7b]
bin/redis-server *:13676(aeMain+0x2b)[0x41ff8b]
bin/redis-server *:13676(main+0x370)[0x4277d0]
/lib64/libc.so.6(__libc_start_main+0xf5)[0x7fbbe67afc05]
bin/redis-server *:13676[0x41d3d9]
3.info all
crash log还包含了info all信息,这个对于排查问题也很有帮助,不过从下面的info并没有发现明显异常。
------ INFO OUTPUT ------
Server
redis_version:3.2.12
redis_git_sha1:00000000
redis_git_dirty:0
redis_build_id:66352db37a13e34e
redis_mode:standalone
os:Linux 3.10.0-693.5.2.el7.x86_64 x86_64
arch_bits:64
multiplexing_api:epoll
gcc_version:4.4.7
process_id:23368
run_id:08d8b04f78f076ed6cab61f385e97133a829c6c3
tcp_port:13676
uptime_in_seconds:11604878
uptime_in_days:134
hz:10
lru_clock:10955654
executable:/xxxxxxxxxx/bin/redis-server
config_file:/xxxxxxxxxx/conf/redis.conf
Clients
connected_clients:8
client_longest_output_list:0
client_biggest_input_buf:0
blocked_clients:0
Memory
used_memory:1130091432
used_memory_human:1.05G
used_memory_rss:1165987840
used_memory_rss_human:1.09G
used_memory_peak:1130145776
used_memory_peak_human:1.05G
total_system_memory:540622544896
total_system_memory_human:503.49G
used_memory_lua:37888
used_memory_lua_human:37.00K
maxmemory:5368709120
maxmemory_human:5.00G
maxmemory_policy:allkeys-lru
mem_fragmentation_ratio:1.03
mem_allocator:jemalloc-4.0.3
Persistence
loading:0
rdb_changes_since_last_save:250957118
rdb_bgsave_in_progress:0
rdb_last_save_time:1542854648
rdb_last_bgsave_status:ok
rdb_last_bgsave_time_sec:-1
rdb_current_bgsave_time_sec:-1
aof_enabled:0
aof_rewrite_in_progress:0
aof_rewrite_scheduled:0
aof_last_rewrite_time_sec:-1
aof_current_rewrite_time_sec:-1
aof_last_bgrewrite_status:ok
aof_last_write_status:ok
Stats
total_connections_received:1342911
total_commands_processed:324231805
instantaneous_ops_per_sec:109
total_net_input_bytes:19959176009
total_net_output_bytes:28617243060
instantaneous_input_kbps:6.28
instantaneous_output_kbps:1.25
rejected_connections:0
sync_full:0
sync_partial_ok:0
sync_partial_err:0
expired_keys:0
evicted_keys:0
keyspace_hits:0
keyspace_misses:0
pubsub_channels:1
pubsub_patterns:0
latest_fork_usec:0
migrate_cached_sockets:0
Replication
role:slave
master_host:10.xx.xx.11
master_port:12676
master_link_status:up
master_last_io_seconds_ago:0
master_sync_in_progress:0
slave_repl_offset:16637646872
slave_priority:100
slave_read_only:0
connected_slaves:0
master_repl_offset:0
repl_backlog_active:0
repl_backlog_size:67108864
repl_backlog_first_byte_offset:0
repl_backlog_histlen:0
CPU
used_cpu_sys:3061.99
used_cpu_user:4084.48
used_cpu_sys_children:0.00
used_cpu_user_children:0.00
Commandstats
cmdstat_set:calls=2580969,usec=5211206,usec_per_call=2.02
cmdstat_del:calls=852409,usec=1577987,usec_per_call=1.85
cmdstat_zadd:calls=8108213,usec=185116242,usec_per_call=22.83
cmdstat_hincrby:calls=215200524,usec=1314563137,usec_per_call=6.11
cmdstat_hdel:calls=13525817,usec=40043633,usec_per_call=2.96
cmdstat_select:calls=1,usec=1,usec_per_call=1.00
cmdstat_expire:calls=10689186,usec=12850505,usec_per_call=1.20
cmdstat_ping:calls=34863107,usec=15125982,usec_per_call=0.43
cmdstat_info:calls=4209908,usec=157930292,usec_per_call=37.51
cmdstat_slaveof:calls=1,usec=44,usec_per_call=44.00
cmdstat_config:calls=417328,usec=4405040,usec_per_call=10.56
cmdstat_subscribe:calls=3,usec=7,usec_per_call=2.33
cmdstat_publish:calls=33774669,usec=85809478,usec_per_call=2.54
cmdstat_client:calls=6,usec=3,usec_per_call=0.50
cmdstat_slowlog:calls=9664,usec=33127,usec_per_call=3.43
Cluster
cluster_enabled:0
Keyspace
db0:keys=1502434,expires=251409,avg_ttl=0
hash_init_value: 1543499382
4. client list
client list包含当前所有连接Redis的客户端,可以看到包含了一些info、publish、ping。这些都是sentinel的定时操作,其中发现zadd命令在其中。
------ CLIENT LIST OUTPUT ------
id=5 addr=10.xx.131.11:12676 fd=6 name= age=11604877 idle=0 flags=M db=0 sub=0 psub=0 multi=-1 qbuf=0 qbuf-free=32768 obl=0 oll=0 omem=0 events=r cmd=zadd
id=6 addr=10.xx.73.30:58144 fd=7 name=sentinel-5c446d86-cmd age=11604872 idle=0 flags=N db=0 sub=0 psub=0 multi=-1 qbuf=0 qbuf-free=0 obl=0 oll=0 omem=0 events=r cmd=ping
id=7 addr=10.xx.73.30:58146 fd=8 name=sentinel-5c446d86-pubsub age=11604872 idle=0 flags=N db=0 sub=1 psub=0 multi=-1 qbuf=0 qbuf-free=0 obl=0 oll=0 omem=0 events=r cmd=subscribe
id=8 addr=10.xx.73.28:42216 fd=9 name=sentinel-0c5acb8f-cmd age=11604872 idle=0 flags=N db=0 sub=0 psub=0 multi=-1 qbuf=0 qbuf-free=0 obl=0 oll=0 omem=0 events=r cmd=publish
id=9 addr=10.xx.73.28:42218 fd=10 name=sentinel-0c5acb8f-pubsub age=11604872 idle=0 flags=N db=0 sub=1 psub=0 multi=-1 qbuf=0 qbuf-free=0 obl=0 oll=0 omem=0 events=r cmd=subscribe
id=10 addr=10.xx.73.29:39148 fd=11 name=sentinel-8257b663-pubsub age=11604872 idle=0 flags=N db=0 sub=1 psub=0 multi=-1 qbuf=0 qbuf-free=0 obl=0 oll=0 omem=0 events=r cmd=subscribe
id=11 addr=10.xx.xx.29:39146 fd=12 name=sentinel-8257b663-cmd age=11604872 idle=0 flags=N db=0 sub=0 psub=0 multi=-1 qbuf=0 qbuf-free=32768 obl=0 oll=0 omem=0 events=r cmd=ping
id=1260384 addr=10.xx.xx.38:49728 fd=13 name= age=692578 idle=179 flags=N db=0 sub=0 psub=0 multi=-1 qbuf=0 qbuf-free=0 obl=0 oll=0 omem=0 events=r cmd=info
5.当前客户端
从下面可以看出当前客户端正在执行如下操作
zadd fpgn_622094516 1.554459526619E9 9909414677
并且给出key的一些信息,譬如它是有序集合,ziplist(encoding=5), 很重要的一个信息就是它的长度是257,这个数字非常敏感,因为我们知道Redis提供了ziplist的相关优化,针对有序集合有一个配置是zset-max-ziplist-entries。
------ CURRENT CLIENT INFO ------
id=5 addr=10.54.131.11:12676 fd=6 name= age=11604877 idle=0 flags=M db=0 sub=0 psub=0 multi=-1 qbuf=0 qbuf-free=32768 obl=0 oll=0 omem=0 events=r cmd=zadd
argv[0]: 'ZADD'
argv[1]: 'fpgn_622094516'
argv[2]: '1.554459526619E9'
argv[3]: '9909414677'
23368:S 05 Apr 18:18:46.628 # key 'fpgn_622094516' found in DB containing the following object:
23368:S 05 Apr 18:18:46.628 # Object type: 3
23368:S 05 Apr 18:18:46.628 # Object encoding: 5
23368:S 05 Apr 18:18:46.628 # Object refcount: 1
23368:S 05 Apr 18:18:46.628 # Sorted set size: 257
6. 寄存器相关信息
------ REGISTERS ------
23368:S 05 Apr 18:18:46.628 #
RAX:0000000000000000 RBX:0000000000000469
RCX:0000000001cc0700 RDX:00007fbbe6b4a7b8
RDI:00007fbbe6b4a760 RSI:0000000000000000
RBP:00000000004e5770 RSP:00007ffd9f14e210
R8 :0000000000000001 R9 :0000000000000000
R10:000000000000002a R11:0000000000000206
R12:00000000004e5a40 R13:00007ffd9f14e27c
R14:00007ffd9f14e258 R15:00007ffd9f14e268
RIP:000000000045c25f EFL:0000000000010202
CSGSFS:7562000000000033
23368:S 05 Apr 18:18:46.628 # (00007ffd9f14e21f) -> 00007fbb990aafa0
23368:S 05 Apr 18:18:46.628 # (00007ffd9f14e21e) -> 00007fbb990aafa0
23368:S 05 Apr 18:18:46.628 # (00007ffd9f14e21d) -> 000000000044db74
23368:S 05 Apr 18:18:46.628 # (00007ffd9f14e21c) -> 00007fbba991664b
23368:S 05 Apr 18:18:46.628 # (00007ffd9f14e21b) -> 00007fbba9916651
23368:S 05 Apr 18:18:46.628 # (00007ffd9f14e21a) -> 0000000000000000
23368:S 05 Apr 18:18:46.628 # (00007ffd9f14e219) -> 000000005bbaee1b
23368:S 05 Apr 18:18:46.628 # (00007ffd9f14e218) -> 00007fbba991735b
23368:S 05 Apr 18:18:46.628 # (00007ffd9f14e217) -> 00007fbbd5570ce0
23368:S 05 Apr 18:18:46.628 # (00007ffd9f14e216) -> 41d729ca59250e56
23368:S 05 Apr 18:18:46.628 # (00007ffd9f14e215) -> 00007fbb990d8720
23368:S 05 Apr 18:18:46.628 # (00007ffd9f14e214) -> 000000000000000a
23368:S 05 Apr 18:18:46.628 # (00007ffd9f14e213) -> 000000000044de5d
23368:S 05 Apr 18:18:46.628 # (00007ffd9f14e212) -> 00007ffd9f14e260
23368:S 05 Apr 18:18:46.628 # (00007ffd9f14e211) -> 00007fbba9915800
23368:S 05 Apr 18:18:46.628 # (00007ffd9f14e210) -> 00007fbbddc78c60
7. 内存测试
Redis提供了--test-memory功能用来测试内存分配,从下面的测试结果看没有出现内存分配不足(譬如OOM)这类问题。
------ FAST MEMORY TEST ------
23368:S 05 Apr 18:18:46.629 # Bio thread for job type #0 terminated
23368:S 05 Apr 18:18:46.629 # Bio thread for job type #1 terminated
* Preparing to test memory region 722000 (94208 bytes)
* Preparing to test memory region 1cb3000 (135168 bytes)
* Preparing to test memory region 7fbb99000000 (1163919360 bytes)
* Preparing to test memory region 7fbbde7ff000 (10485760 bytes)
* Preparing to test memory region 7fbbdf200000 (10485760 bytes)
* Preparing to test memory region 7fbbdfc00000 (2097152 bytes)
* Preparing to test memory region 7fbbe6400000 (2097152 bytes)
* Preparing to test memory region 7fbbe6b4c000 (20480 bytes)
* Preparing to test memory region 7fbbe6d69000 (16384 bytes)
* Preparing to test memory region 7fbbe7480000 (16384 bytes)
* Preparing to test memory region 7fbbe7492000 (4096 bytes)
* Preparing to test memory region 7fbbe7493000 (4096 bytes)
* Preparing to test memory region 7fbbe7496000 (4096 bytes)
.O.O.O.O.O.O.O.O.O.O.O.O.O
Fast memory test PASSED, however your memory can still be broken. Please run a memory test for several hours if possible.
------ DUMPING CODE AROUND EIP ------
Symbol: _serverAssert (base: 0x45c1f0)
Module: bin/redis-server *:13676 (base 0x400000)
$ xxd -r -p /tmp/dump.hex /tmp/dump.bin
$ objdump --adjust-vma=0x45c1f0 -D -b binary -m i386:x86-64 /tmp/dump.bin
23368:S 05 Apr 18:18:50.244 # dump of function (hexdump of 239 bytes):
48895c24e848896c24f089d34c896424f84883ec184989fc4889f5e810ffffffbee5824e00bf0300000031c0e83f9dfcff4d89e089d94889eabefe824e00bf0300000031c0e8269dfcffbe38894e00bf0300000031c04c8925bbb42d0048892dbcb42d00891dbeb42d00e8019dfcffc60425ffffffff78488b1c24488b6c24084c8b6424104883c418c3660f1f44000048895c24d048896c24d84889fb4c896424e04c896c24e84c897424f04c897c24f84881ec680800004883fe040f86ae0000004889f54883ed040f84a1000000488d7c2410b90001000031c04531e44c8d7b054c8db42410080000f348abeb09
=== REDIS BUG REPORT END. Make sure to include from START to END. ===
Please report the crash by opening an issue on github:
http://github.com/antirez/redis/issues
Suspect RAM error? Use redis-server --test-memory to verify it.
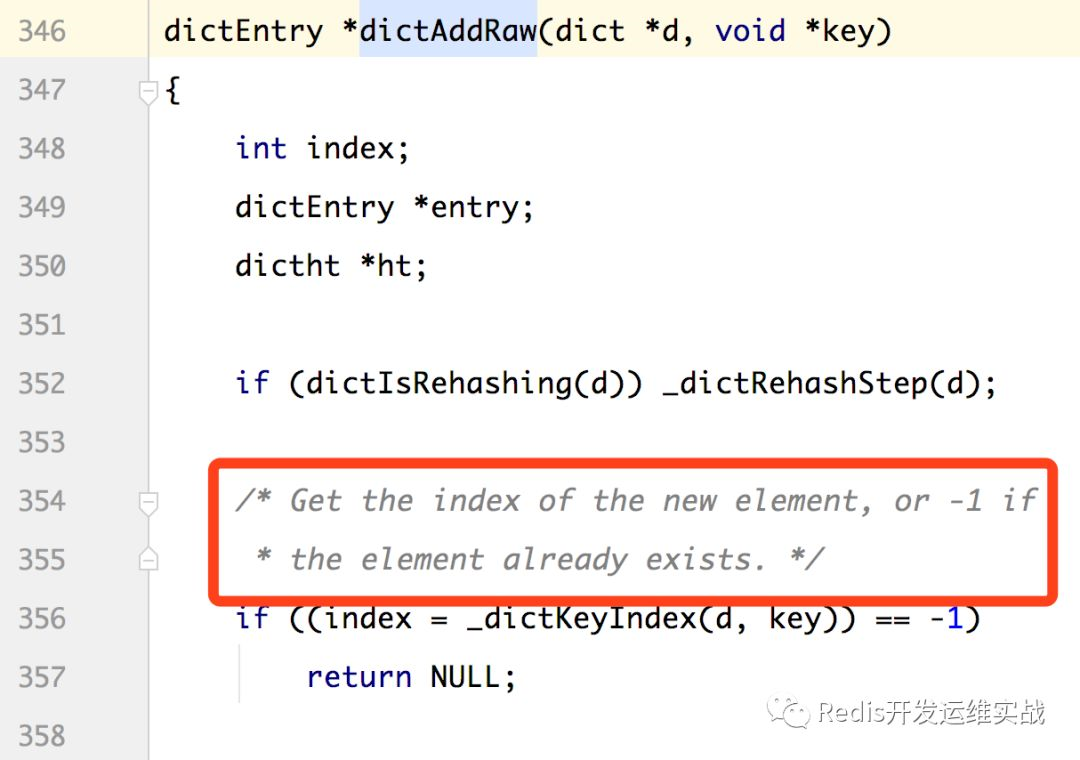
二、源码分析
初步分析是:zadd后当有序集合需要从ziplist转成skiplist这个期间造成了core,其中最奇怪的是dictAdd插入失败,造成core:
serverAssertWithInfo(NULL,zobj,dictAdd(zs->dict,ele,&node->score) == DICT_OK);
define serverAssertWithInfo(_c,_o,_e) ((_e)?(void)0 : (_serverAssertWithInfo(_c,_o,#_e,__FILE__,__LINE__),_exit(1)))
看下什么原因会造成dictAdd会造成失败,很明显如果哈希表包含了元素,则插入失败。
三、内存分析
所以最好的方法就是分析下当前ziplist里都是什么就比较清楚了,于是在朋友的帮助下使用GDB完成了ziplist的分析,具体分析如下:
1. gdb redis-server core.pid
2. bt查看当前堆栈
3. 跳到zsetConvert函数
$ gdb redis-server core.23368
GNU gdb (GDB) Red Hat Enterprise Linux 7.6.1-100.el7
Copyright (C) 2013 Free Software Foundation, Inc.
License GPLv3+: GNU GPL version 3 or later
This is free software: you are free to change and redistribute it.
There is NO WARRANTY, to the extent permitted by law. Type "show copying"
and "show warranty" for details.
This GDB was configured as "x86_64-redhat-linux-gnu".
For bug reporting instructions, please see:
...
Reading symbols from /home/redis_server/gdb/src/redis-server...done.
[New LWP 23368]
[Thread debugging using libthread_db enabled]
Using host libthread_db library "/lib64/libthread_db.so.1".
Core was generated by `bin/redis-server *:13676 '.
Program terminated with signal 11, Segmentation fault.
0 0x00007fbbe67c34c7 in kill () from /lib64/libc.so.6
Missing separate debuginfos, use: debuginfo-install glibc-2.17-196.el7.x86_64 libgcc-4.8.5-16.el7.x86_64
(gdb) bt
0 0x00007fbbe67c34c7 in kill () from /lib64/libc.so.6
1 0x000000000045d7a6 in sigsegvHandler (sig=11, info=, secret=) at debug.c:1107
2
3 _serverAssert (estr=0x4e5a40 "dictAdd(zs->dict,ele,&node->score) == DICT_OK", file=0x4e5770 "t_zset.c", line=1129) at debug.c:567
4 0x000000000044de5d in zsetConvert (zobj=0x7fbbd5570ce0, encoding=) at t_zset.c:1117
5 0x000000000044e5f7 in zaddGenericCommand (c=0x7fbbdfd2ac00, flags=0) at t_zset.c:1328
6 0x0000000000424652 in call (c=0x7fbbdfd2ac00, flags=15) at server.c:2265
7 0x000000000042a5f5 in processCommand (c=0x7fbbdfd2ac00) at server.c:2544
8 0x0000000000435349 in processInputBuffer (c=0x7fbbdfd2ac00) at networking.c:1311
9 0x000000000041fc7b in aeProcessEvents (eventLoop=0x7fbbdfc520a0, flags=3) at ae.c:431
10 0x000000000041ff8b in aeMain (eventLoop=0x7fbbdfc520a0) at ae.c:489
11 0x00000000004277d0 in main (argc=, argv=0x7ffd9f14e5a8) at server.c:4133
(gdb) up 4
4 0x000000000044de5d in zsetConvert (zobj=0x7fbbd5570ce0, encoding=) at t_zset.c:1117
1117 serverAssertWithInfo(NULL,zobj,sptr != NULL);
4. print zl可以看到ziplist的起始地址0x7fbba9915800
5. print (uint32_t )zl 可以看到ziplist的整个内存长度
6. 算一下内存的结束地址就是0x7fbba9915800 + 7046,把它dump出来,文件名是zl.bin
(gdb) print zl
$1 = (unsigned char *) 0x7fbba9915800 "\206\033"
(gdb) print (uint32_t )zl
$2 = 7046
(gdb) dump binary memory zl.bin 0x7fbba9915800 0x7fbba9917386
(gdb)
7.搞出ziplist的元素
感谢Redis的代码做的非常好,可以直接抽出ziplist.h和ziplist.c的代码,然后直接分析即可。
include
include
include "ziplist.h"
int main(int argc, char argv, char env)
{
FILE *fp = fopen("zl.bin", "r");
if (fp == NULL) {
return -1;
}

unsigned char *buff;
const int buff_len = 1024 * 1024;
int n;

buff = (unsigned char *)malloc(sizeof(unsigned char) * buff_len);
memset(buff, 0, buff_len);
n = fread(buff, 1, buff_len, fp);
printf("read %d bytes from file\\n", n);

unsigned char *zl = buff;
printf("ziplist ziplistBlobLen: %d\\n", ziplistBlobLen(zl));
printf("ziplist length: %d\\n", ziplistLen(zl));

unsigned char *vstr;
unsigned int vlen;
long long vlong;
int count = 0;

unsigned char *eptr = ziplistIndex(zl, 0);
while (eptr != NULL) {
    if (!ziplistGet(eptr, &vstr, &vlen, &vlong)) {
        printf("ziplistGet error\\n");
        return -1;
    }
    if (vstr != NULL) {
        printf("%.*s", vlen, vstr);
    } else {
        printf("%ld", vlong);
    }

    count++;
    if (count % 2 == 0) {
        printf("\\n");
    } else {
        printf("\\t");
    }
    eptr = ziplistNext(zl, eptr);
}

return 1;
}
8.打印结果
打印结果如下:
9214265314 1553754978.737 9219488144 1553870247.78
9231561063 1553870251.464
9242373948 1553997540.007
9259890295 1554028774.51
9257100883 1554028775.9579999
1538977307 1554028801.122
1092128962 1554028836.783
11876497062 1554431862.875
11851454532 1554431882.921
891110276 1554434117.8499999
894962802 1554434119.3150001
897740518 1554434128.2160001
907153595 1554434129.7079999
907181453 1554434131.076
911054502 1554434132.5280001
914890585 1554434142.335
920964455 1554434145.152
925969447 1554434146.684
944318152 1554434148.187
11941804660 1554436129.1800001
11777171286 1554458806.0120001
11742093620 1554458807.6889999
11715534010 1554458809.21
11672716772 1554458810.5769999
11613432078 1554458811.905
11550414593 1554458813.118
11517996744 1554458814.3759999
11500440617 1554458815.6140001
11478161354 1554458816.8369999
11414301904 1554458818.0739999
11346206035 1554458819.346
11291115246 1554458820.677
11222756856 1554458821.925
11150265728 1554458823.283
10970608813 1554458824.562
10938234745 1554458825.924
10899399365 1554458827.2939999
10767275989 1554458828.6630001
10636374981 1554458829.97
10570534567 1554458831.2850001
10413570162 1554458832.5929999
10322754271 1554458833.9170001
10288894258 1554458835.2820001
10193805582 1554458836.668
10076352932 1554458838.0050001
10029661763 1554458839.3329999
9949953433 1554458840.605
9921804300 1554458841.905
9876247658 1554458843.214
9838633213 1554458844.45
9827369980 1554458845.6900001
9834835967 1554458846.911
9863721076 1554458848.1240001
9913807532 1554458849.405
9925439612 1554458850.7290001
9965771927 1554458851.9749999
10052127085 1554458853.3410001
10166124816 1554458854.6240001
10272503804 1554458855.911
10299486881 1554458857.175
10338316514 1554458858.552
10581422345 1554458859.948
10715267394 1554458861.3800001
10803628815 1554458862.618
10929235600 1554458863.9159999
10969664947 1554458865.342
11066226539 1554458866.737
11175727068 1554458868.1530001
11263315139 1554458869.378
11304479114 1554458870.6300001
11370286250 1554458871.9319999
11389491458 1554458873.3340001
11427628908 1554458874.6600001
11456536043 1554458876.2149999
11516371481 1554458877.7160001
11540708208 1554458879.375
11582620855 1554458880.8429999
11655652844 1554458882.3169999
11698754987 1554458883.7149999
9803405207 1554458885.1140001
9781060124 1554458886.5120001
9720915125 1554458888.105
9680646105 1554458889.4679999
9662998980 1554458890.8139999
9652810907 1554458892.348
9628039023 1554458896.3169999
9557079656 1554458897.5999999
9536221322 1554458898.914
9516506403 1554458900.1849999
9525740535 1554458901.5139999
9544370106 1554458902.8239999
9580825848 1554458904.171
9644207950 1554458905.5610001
9661134686 1554458906.8570001
9667805988 1554458908.1689999
9707690522 1554458909.7880001
9739840217 1554458911.3169999
9793667195 1554458913.155
9814930331 1554458915.027
9467104725 1554458917.8110001
9460402940 1554458919.299
9443012513 1554458920.7320001
9422448568 1554458922.013
9390005464 1554458923.352
9350505954 1554458924.721
9316738871 1554458926.098
9304287892 1554458927.517
7665813588 1554458929.5829999
5132031042 1554458930.9319999
11789573057 1554458933.431
11770218038 1554458937.118
9473751026 1554458942.5869999
9464969176 1554458946.0139999
9451812057 1554458948.2290001
9430611330 1554458949.994
9401012549 1554458951.635
9380107339 1554458953.2149999
9337256629 1554458954.8299999
5131960833 1554458957.3659999
4517860072 1554458959.191
2844765977 1554458962.0469999
2831001627 1554458963.858
2545262460 1554458965.427
1597238347 1554458967.0150001
1275903665 1554458968.5280001
1182075767 1554458969.951
1151554587 1554458971.7420001
1121506654 1554458973.187
1119751110 1554458974.8789999
1112271696 1554458976.345
1151500542 1554458977.733
1115899417 1554458979.1300001
1538977307 1554458980.579
1274523566 1554458982.382
1680459122 1554458983.9990001
2829501050 1554458985.4449999
2836117692 1554458986.868
3259875873 1554458988.329
1104057891 1554458989.888
1092128962 1554458991.392
1029490033 1554458992.8529999
1022869312 1554458994.3380001
1016040233 1554458995.862
989853532 1554458997.431
972561774 1554458998.9519999
965710674 1554459000.4519999
957049365 1554459001.8410001
939739488 1554459003.4809999
949177731 1554459005.115
960613220 1554459006.6300001
966557783 1554459008.1340001
965679520 1554459009.5680001
969338958 1554459011.0840001
1003210949 1554459012.8150001
1018888308 1554459014.5320001
1016121625 1554459016.0810001
1029148729 1554459017.7579999
1091660523 1554459019.53
9312712062 1554459021.4820001
9268466953 1554459023.6029999
7627407505 1554459026.73
11927650707 1554459031.632
11899902967 1554459033.2449999
11829370281 1554459248.7030001
11799126653 1554459252.5150001
11855731105 1554459256.5120001
11876840880 1554459258.8510001
11769638514 1554459262.5810001
11742438742 1554459264.26
11722142361 1554459266.052
11698302198 1554459269.819
11674927600 1554459271.349
11620531706 1554459275.6110001
11593826867 1554459277.1470001
11652331020 1554459280.7019999
11544287484 1554459282.3510001
11566492789 1554459285.733
11523335182 1554459289.5369999
11499632665 1554459291.3340001
11479496181 1554459294.1949999
11446109398 1554459297.1530001
11375611642 1554459301.8959999
11419583096 1554459303.8929999
11395153806 1554459305.506
11334667261 1554459308.204
11313762930 1554459309.743
11355248256 1554459311.503
11284309708 1554459315.5680001
11255776440 1554459317.1129999
11230762164 1554459318.6400001
11180118692 1554459319.957
11173103151 1554459321.404
11153679337 1554459322.869
11122412124 1554459324.336
11098304804 1554459325.898
11194229625 1554459330.7
11210997991 1554459332.1949999
11021285607 1554459334.155
10951395470 1554459338.9330001
10933033189 1554459340.45
10909504057 1554459342.1159999
11077766158 1554459345.513
11059689566 1554459347.3859999
11040152098 1554459349.0369999
10829099231 1554459353.237
10802780063 1554459354.72
10793874021 1554459356.339
10978316673 1554459360.506
10879528496 1554459361.9300001
10852033097 1554459363.365
10779040475 1554459368.175
10750780775 1554459369.651
10723523678 1554459371.0710001
10695037719 1554459372.4879999
10643170157 1554459373.9400001
10616854605 1554459375.3510001
10669969745 1554459377.388
10324013139 1554459406.0409999
10300254143 1554459407.8570001
10273675648 1554459411.684
10249228453 1554459413.414
10225537311 1554459416.954
10180347038 1554459419.21
10136770975 1554459420.7939999
10159712300 1554459422.1559999
10110131870 1554459425.727
10067720184 1554459427.404
10026495289 1554459430.0209999
9985320927 1554459431.858
9944381217 1554459436.247
10004339597 1554459439.868
9967176641 1554459441.5999999
9927499934 1554459446.0929999
9460008595 1554459465.4100001
9476346126 1554459470.974
9497113499 1554459472.845
9519284473 1554459476.529
9534525191 1554459478.26
9551711207 1554459481.348
9583121160 1554459484.4000001
9622885843 1554459486.0420001
9645088236 1554459489.53
9668057612 1554459493.8139999
9694780480 1554459495.608
9711090967 1554459498.7190001
9725196402 1554459500.4100001
9740875788 1554459503.3859999
9761084768 1554459507.277
9780834435 1554459508.8789999
9796914997 1554459512.2090001
9812416676 1554459514.0469999
9828607002 1554459517.165
9850282068 1554459520.7179999
9866725779 1554459522.5090001
9887380747 1554459525.063
9909414677 1554459526.619
从结果可以看出,这个ziplist的数据,第134个和第7个key一样了。至此问题发现了,但是就没有但是了,为什么会出现这种情况就不知道了,我也提交了issue(#5995)暂时没有回复,看看哪位大佬知道怎么进一步分析。还有一些信息:
当时core的是slave节点,master节点正常,slave重启后就恢复了。
如果觉得我的文章对您有用,请点赞。您的支持将鼓励我继续创作!
赞0作者其他文章
评论 1 · 赞 8
评论 0 · 赞 4
评论 0 · 赞 0
评论 0 · 赞 3
评论 0 · 赞 4
添加新评论0 条评论